- Home
- Financial Information
Financial Information
- Financial Review [PDF] (116 KB)
- Consolidated Balance Sheets [PDF] (21 KB)
- Consolidated Statements of Income [PDF] (21 KB)
- Consolidated Statements of Changes in Equity [PDF] (28 KB)
- Consolidated Statements of Cash Flows [PDF] (27 KB)
- Note to Consolidated Financial Statements [PDF] (120 KB)
- Independent Auditors' Report [PDF] (1,005 KB)
Financial Highlights
| Millions of Yen*1 | Thousands of U.S. Dollars*2 | ||||||
| 2011 | 2010 | 2009 | 2008 | 2007 | 2006 | 2011 | |
| For the Year: | |||||||
|---|---|---|---|---|---|---|---|
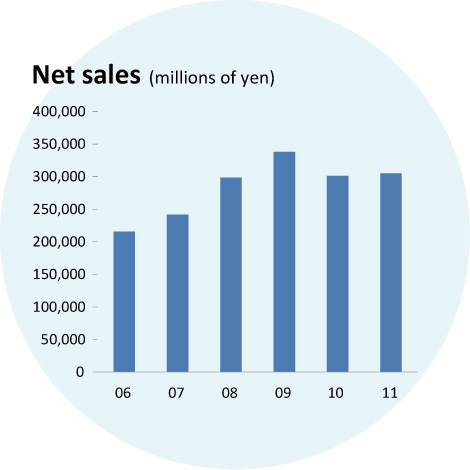
| Net sales | ¥305,298 | ¥301,299 | ¥337,925 | ¥298,196 | ¥241,668 | ¥215,479 | $3,678,289 |
| Oils and Meal | 280,324 | 276,079 | 312,610 | 272,648 | 216,334 | 188,979 | 3,377,398 |
| Healthy Foods and Soy Protein | 9,377 | 9,686 | 8,696 | 8,616 | 8,571 | 6,500 | 112,976 |
| Fine Chemicals | 5,864 | 5,742 | 5,254 | 5,405 | 4,878 | 4,483 | 70,650 |
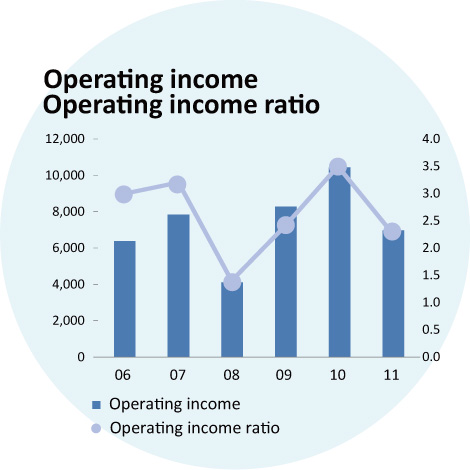
| Operating income | 6,966 | 10,435 | 8,272 | 4,114 | 7,835 | 6,386 | 83,928 |
| Net income | 2,123 | 5,104 | 3,066 | 1,876 | 6,202 | 7,138 | 25,578 |
| Cash Flows: | |||||||
| Net cash provided by (used in) operating activities |
(¥1,293) | ¥11,458 | ¥26,690 | (¥16,849) | ¥6,890 | ¥8,928 | ($15,578) |
| Net cash used in investing activities | (5,086) | (12,194) | (5,856) | (3,854) | (6,968) | (6,726) | (61,277) |
| Net cash provided by (used in) financing activities |
509 | (3,135) | 22 | 16,345 | (2,186) | 1,273 | 6,132 |
| Cash and cash equivalents at the end of the year |
15,993 | 22,665 | 26,475 | 6,166 | 10,354 | 12,401 | 192,687 |
| At Year-End: | |||||||
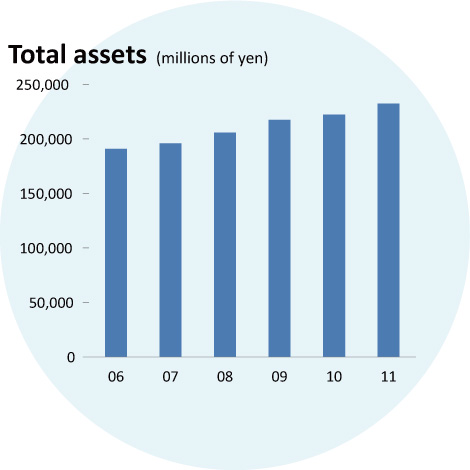
| Total assets | ¥232,311 | ¥222,358 | ¥217,488 | ¥205,824 | ¥196,008 | ¥190,829 | $2,798,928.00 |
| Equity | 117,422 | 114,816 | 107,498 | 109,406 | 112,282 | 103,785 | 1,414,723 |
| Per Share Data (Yen and U.S. dollars): | |||||||
| Net income | ¥12.32 | ¥29.62 | ¥17.79 | ¥10.87 | ¥35.91 | ¥41.00 | $0.15 |
| Cash dividends applicable to the year | 10.00 | 10.00 | 10.00 | 10.00 | 10.00 | 7.50 | 0.12 |
| Financial Ratios (%): | |||||||
| ROE (Net income base) | 2.0 | 4.7 | 2.9 | 1.8 | 5.7 | 6.9 | |
| ROA (Ordinary income base) | 2.8 | 4.6 | 3.7 | 2.2 | 5.2 | 4.7 | |
| Equity ratio | 46.9 | 48.3 | 46.6 | 50.7 | 55.0 | 54.4 | |
| Operating income ratio | 2.3 | 3.5 | 2.4 | 1.4 | 3.2 | 3.0 | |
Financial Highlights 2011 [Excel] (36 KB)

- Financial Review [PDF] (116 KB)
- Consolidated Balance Sheets [PDF] (21 KB)
- Consolidated Statements of Income [PDF] (21 KB)
- Consolidated Statements of Changes in Equity [PDF] (28 KB)
- Consolidated Statements of Cash Flows [PDF] (27 KB)
- Note to Consolidated Financial Statements [PDF] (120 KB)
- Independent Auditors' Report [PDF] (1,005 KB)
![]()